Looking to login to start testing? Click Here
Looking to login to start testing? Click Here

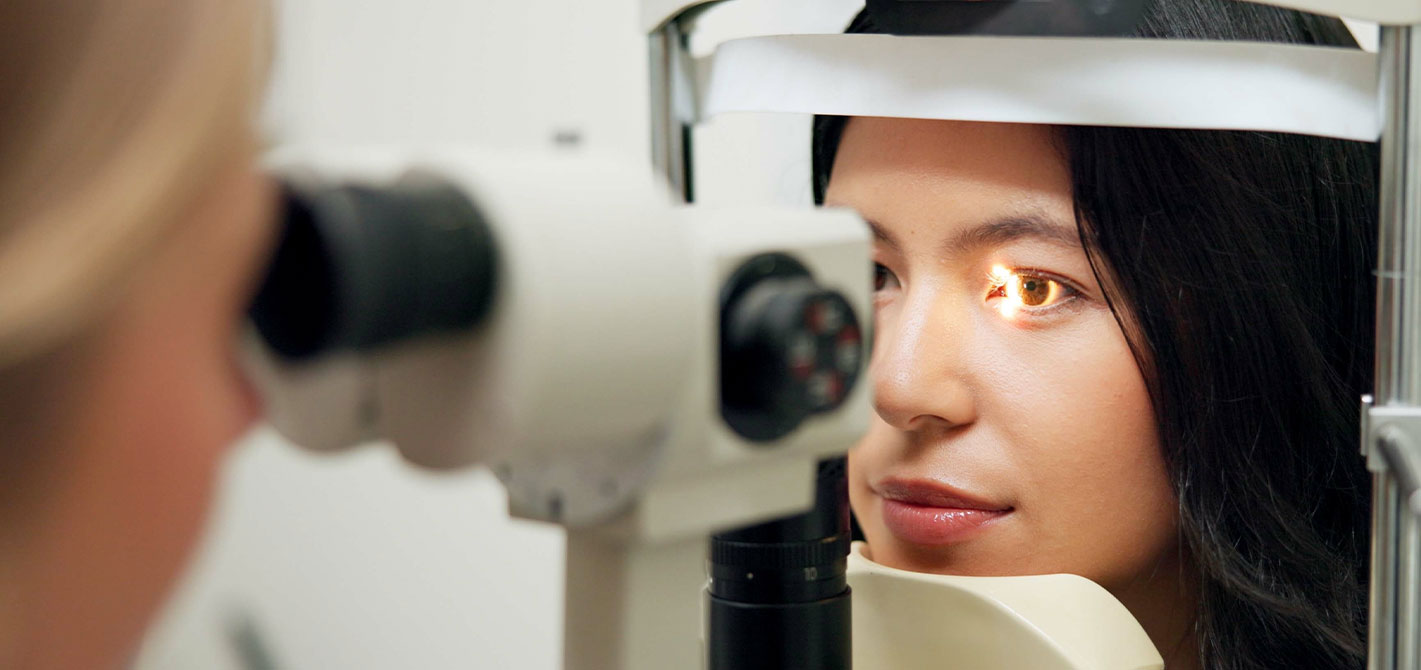
Visual field testing (also known as perimetry) is commonly used to assess peripheral vision in each eye to assess for glaucoma.
Visual field testing allows for early detection of glaucoma. If detected early glaucoma can be halted, saving people from irreversible vision loss. Glaucoma is the most common cause of preventable blindness globally.
It is great to have a normal visual field test, but it does not necessarily mean you do not have any eye conditions. In early cases of glaucoma, the visual field test may be normal. It is important to note that visual field testing is complementary to clinical evaluation and other tests by an eye care clinician. We do not recommend visual field testing without care from an eye care clinician.
Not necessarily. There are many causes of an abnormal visual field test, of which glaucoma is just one. The test can often reveal spurious false results, and there may be nothing wrong with your eyes; so it is best to get checked by an eye care professional.
The visual field test generates a map of your peripheral vision over a 10 or 24 degree area of vision. The Sensitivity displays show how sensitive your vision is at each testing spot. The top sensitivity map shows the raw scores at each spot, while the lower image shows a greyscale impression of the sensitivity scores. Your raw sensitivity scores are compared to age-matched normal: to generate your Total Deviation displays. Because some conditions (such as incorrect spectacle correction or cataract) can affect the overall sensitivity of the visual field, this can be subtracted out to reveal focal areas of any defects: this generates the Pattern Deviation displays. For both Total Deviation and Pattern Deviation there are two maps. The higher map (with numbers) shows the comparison between the age-matched normal and your scores, and the lower map (with the dots) shows if there is any major deviation between your test and normal. The significance of any deviation is depicted with dark rectangles instead of dots: the darker the rectangle, the more significant the deviation. The lower Pattern Deviation map is the most important of all the maps which describe your peripheral vision.
Most patients with glaucoma are advised to have 6 tests within the first 2 years, and thereafter every 6 months; higher risk patients may need testing more frequently (eg 3-4 monthly). People at risk of glaucoma should be tested every 6-12 months.
The best summary score is the VFI, (Visual Field Index), demonstrated at the top of the results page. This shows a percentage, out of 100, of your eye’s overall visual field compared to normal. The other data (MD, PSD) are more technical data used by clinicians to analyse other aspects of the visual field.
A visual field test asks people what they can see: it is a subjective test, and this brings room for error and inaccuracy. The test is designed to find the very dimmest spots that you can see. However the test has some clever ways to assess reliability, based on False Positive, False Negative responses and Fixation Losses. If these are too high then the test will be described as “Low Test Reliability”. Otherwise you can be confident it is a high quality test.
Eyeonic places cybersecurity and data privacy at the core of its design. Developed with support from Microsoft and hosted on the secure Azure cloud ecosystem, Eyeonic’s web-based visual field test platform is built with industry-leading security practices. All user data is encrypted both in transit and at rest, access is restricted through strong password policies and two-factor authentication, and accounts are protected with advanced tools like Auth0. Clinicians undergo identity verification, and patients retain full control over their personal health data, including who can access it. Internally, Eyeonic applies rigorous development standards, secure coding practices, private repositories, and continuous vulnerability assessments to ensure platform integrity. By embedding cybersecurity into every layer of its architecture, Eyeonic delivers a safe, reliable, and compliant service aligned with international data protection laws.
During the test the position of the head and the focus point of the eye being tested is constantly assessed. If the patient moves the test will be paused and verbal and onscreen instructions will be provided instructing the patient to move closer or further away from the monitor. Once the patient is back in the correct position the test will resume. Similarly, if the SW detects that the patient is not looking at the spinning star, verbal instructions will remind them where to focus.
A visual field test is a test of a person’s peripheral vision. Testing one eye at a time, the person is asked to maintain their gaze on a central target. Each location in their peripheral vision is then tested for visual sensitivity – this generates a map of that eye’s visual field. Multiple test targets are presented, some easier to see and some harder; the result being to determine what the eye can discern at each location of the visual field. The position of targets on the visual field is measured in degrees of visual angle. The very center (the point of fixation) is 0 degrees of visual angle– and as we move farther from centre the visual angle increases. It is common to assess the central 24 degrees for each eye. This is normally achieved by testing 52 locations, at 6-degree intervals. Once the visual sensitivity at each location are determined, these are compared to age-adjusted normal values; if the sensitivity is reduced compared to normal this is noted as a visual field deficit.
Eyeonic turns a standard computer or tablet into a sophisticated visual field testing device:
You are asked to cover one eye and keep your gaze on a central target.

Small light stimuli are shown at different points of your peripheral vision. Some are easier to see, others are dimmer – this helps determine the faintest spots you can detect.
The test usually focuses on the central 24 degrees of your vision, using dozens of test locations. From your responses, a map of your visual field is generated for each eye.
Your sensitivity at each point is compared with age-matched normal data. Areas that are reduced are flagged as potential visual field defects for your clinician to interpret.
Throughout the test, Eyeonic uses your device’s camera to monitor head position and gaze. If you move too far, too close, or away from the fixation target, the test pauses and on-screen and verbal instructions guide you back into the correct position before continuing.


The shared vision of reducting blindness globally through improved access to critical eyecare diagnosis via digital products is being realised.
Start Today